
Skills

Excel | Python | SQL | Power BI
Featured Projects
Excel | SuperMarket Analysis
Analyzing sales, customer satisfaction, and profitability to optimize operations and guide strategic decisions for a Myanmar supermarket chain using Excel.


Python | A Blackjack Montecarlo simulation
A simple MonteCarlo Simulation displayed on Streamlit (limited) that shows a simple case of Montecarlo Simulation of a Blackjack Game.
Excel | SuperMarket Analysis
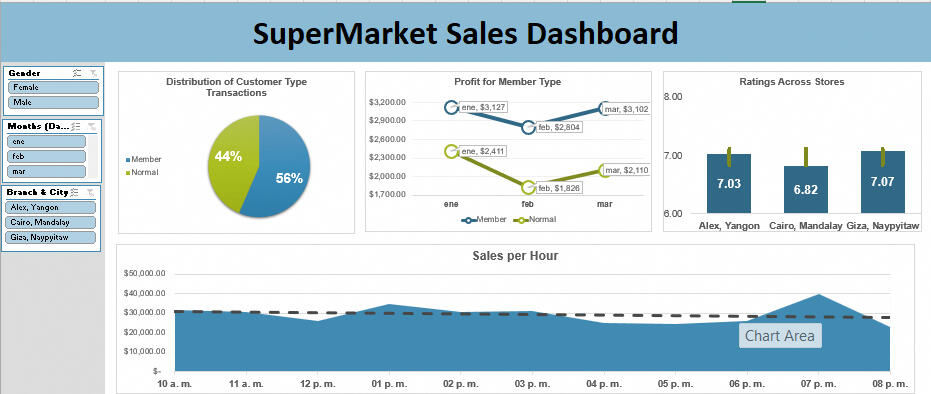
This project focuses on a newly established Myanmar supermarket chain with three branches, recording sales from January 2019 to March 2019. With the implementation of a modern sales system that tracks transactions and supports membership programs, the chain is now positioned to analyze its operations effectively.The chief manager aims to gain insights into:1) How are sales distributed between customer types (Normal vs. Member)?
2) What are the sales ratings for each branch, and what do they reveal about customer satisfaction?
3) How much profit has been accumulated over the period by each customer type?
4) How does sales performance vary by hour, and what insights can be drawn about operational efficiencies and opportunities?These insights will guide strategic decisions to enhance the supermarket chain's overall performance and profitability.I took the following steps to create my analysis:
1) Pulling data from Kaggle.
2) Utilizing Pivot Tables to extract key findings.
3) Creating graphs based on the Pivot Tables.
4) Adding slicers to filter all graphs dynamically.
5) Implementing macros to enhance visualization and add an average line.
6) Format all dashboard sections for consistency and creating an overall theme.Here are the takeaways found:
1) How are sales distributed between customer types (Normal vs. Member)?

Key Insights:
44% of all transactions throughout the company's operations have been made by normal customers, while 56% have been made by member customers.
Over three months, 56% of all sales have been made by member customers, indicating that customers are increasingly finding membership a more appealing choice.
2) What are the sales ratings for each branch, and what do they reveal about customer satisfaction?

Key Insights:
The ratings are relatively consistent across the stores, with standard deviations ranging from 1.70 to 1.73, showing moderate variability.
Giza, Naypyitaw has the highest average rating.
Cairo, Mandalay has the lowest average rating.
3) How are sales distributed between customer types (Normal vs. Member)?

Key Insights:
Members consistently generate higher profits compared to normal customers.
The profit trends—including periods of growth and decline—are remarkably similar for both member and normal customers across all branches